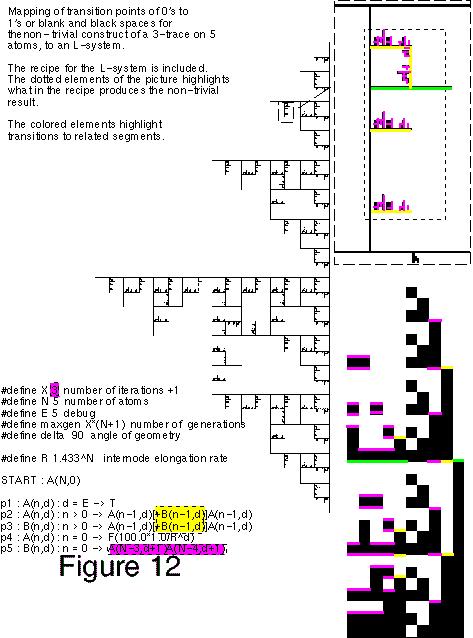
Looking at Figure 2, notice that the representation for trivial traces, the 4 first main columns, equals the representation for the 2-trace case. The strategy to build an L-system representation for trivial 3 traces hence repeats the approach used in the L-system for a 2-trace.
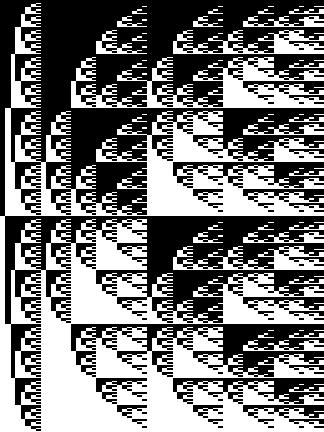
Figure 10 shows a 3-trace on 4-atom truth table and its correspondence as an L-system. Again transitions form 1's to 0's are highlighted. Similar conclusion are reached as in the 2-trace case where there are segments being produced that do not find an equivalence in the truth table.
A 3-trace on 4 atoms produces one result. The morphology of this result shows a repeat of main column q, in a reduced scale, or 3 transitions from 1's to 0's, in the upper part of the table. The lower portion shows 2 additional transition, in equal scale, counting the transition that marks the middle of the table for trivial trace.
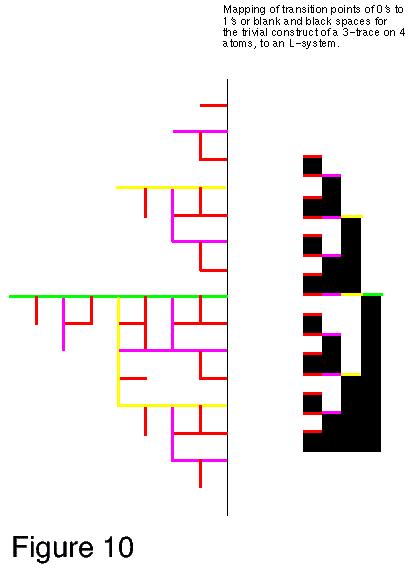
The L-system representing the 3-trace result generates a structure which mirrors a 3 segment production that is seen in the upper half of the table and 2 additional segment which reflects the lower half of the table. Figure 11 indicates the mapping between truth table and L-system and what in the recipe produces the representation for the resulting 3-trace.
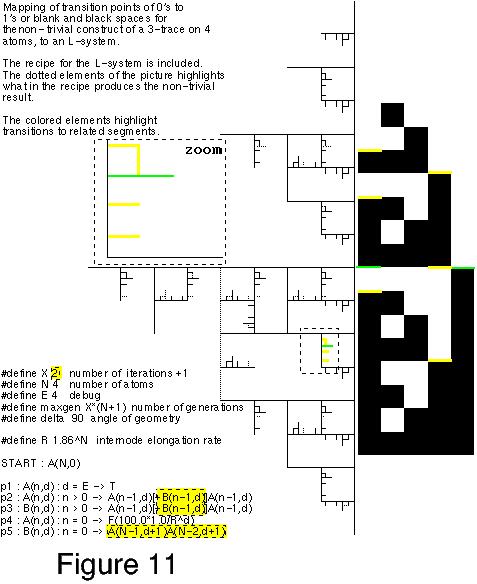
The next representations tackle the 3-trace on 5 atoms problem. A similar approach as in the 2-trace on 4 atoms is taken. A 3-trace on 5 atoms produces 5 results, the first of which show 5 transitions between 1's and 0's and 4 results that show 10 transitions, still counting the one which folds the the trivial trace table in 2 equal parts.
Again, the approach is to generates a production that represents the first non trivial result, a production that show 5 segments. An additional production yields the rest of the results, showing 10 segments for 10 transitions.
An analysis of the result show that the first production for a non-trivial trace generate 4 segments for a 4 transition representation and 4 productions of 10 segments that are generated on the previously mentioned 4 segments. This is consistent with the representation given by the truth table. Figure 12 identifies the mapping from truth table to L-system and highlights what, in the L-system recipe, generates the segments for representing non- trivial results.
As in all previous L-system representation for traces, the extra productions may represent isomorphisms which are hidden in the truth table representation.
The 4 L-systems that have been generated to represent 2 and 3-traces show that there are some discrepancies, however it is not clear as of yet how to approach this new problem. The examples do give insight as to the scales at which all the different partitioning occur. This is not apparent in the truth table representation.