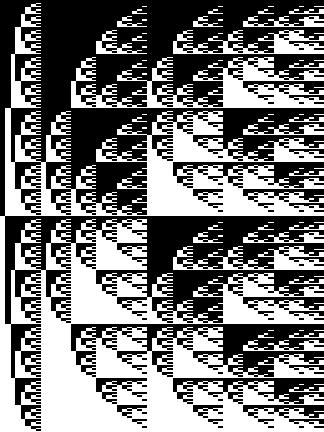
The Figures are computer-generated tables that show the value 1 as being represented by a black pixel and 0 by a white or blank space. It is a relatively straightforward matter to generate sufficiently many successive principal columns for patterns to emerge. Figure 1 displays all trivial and least non-trivial 2-traces over a set of 8 atoms. Its simple fold property is immediately apparent, the lower half of the figure being the reverse mirror image of the upper.
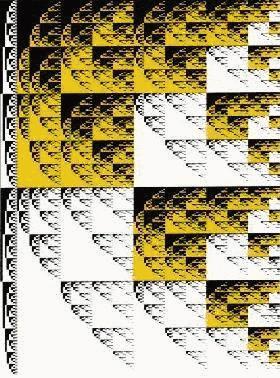
Figure 2, which displays (by principal column) all trivial and least non-trivial
3-traces over a set of 9 atoms, embeds Figure 1 in its upper left
quadrant. The simple fold property of non-trivial 2-traces of
that quadrant (1's colored yellow) is apparent. ![]()
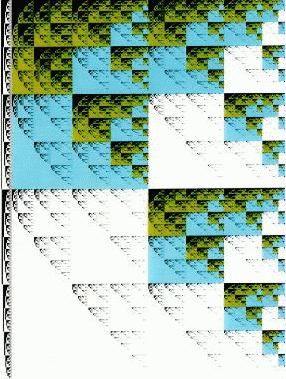
In successive halvings of the array, embedded 2-traces appear on successively reduced scales (shown with tinted 1's). Since all least non-trivial 3-traces are isomorphic, the array displays (within isomorphism) all embedded 2-traces, and therefore exhaustively accounts for the derivative fold properties of such 3-traces. In Figure 3, a 3-trace is embedded in a 4-trace shown as the blue section and an embedded 2-trace is shown as the green section. The values produced in Figure 1 have been verified to match the array of Figure 2 where similarity is visually evident. Therefore a visual proof is given, saying that least non-trivial 3-traces embed 2-traces, also 2-trace arrays are sufficient for the construction of such 3-trace arrays.
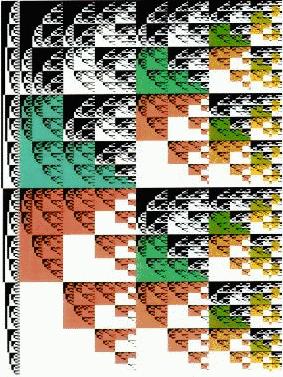
The arrays reveal patterns, and through those patterns the important fold properties that, though theoretically expected, were all but inaccessible without the visualization. They also reveal unexpected patterns, the precise significance of which, for the project in hand, is not yet apparent. These patterns have a repetitive quality. That is, respective pieces of main columns repeat a pattern after n number of generations. It is noticeable in figure 1,2,and 3 where, for example, not only the colored areas are repeated, but also different parts of the picture as shown in figure 4. Figure 4 shows that it is possible to construct a table for a 3-trace using the complete array of a 2-trace and portions of its columns. It also shows parts of the drawing that do not display the reverse mirror image quality and still get repeated as a scale down patterns throughout the picture. An analysis of the patterns show a systematic construction. Building blocks are put onto one and other as a kind of tree like structure. Sequences of blank and black spaces go from large aireas getting smaller and smaller as the image progresses from left to right, not onlike branches on a tree.
These patterns show a systematic organization that is reminiscent of apical growths in biological processes. To see if this behavior can be explored outside of truth tables, it is necessary to use a visualization which can support the idea of apical growth and still be relevant to the logical problem at hand. Such a tool exit in the language for L-systems.